Skip to main content
Let's talk
Menu
Why us
Our difference
Reviews
Clients
Compliance
Expertise
Creative Marketing Strategy
Brand Design + Development
Web Design + Development
Wordpress Hosting
Domains
Creative Subscription
Work
About
Insights
Free Consultation
Client Portal
We've updated our brand identity.
Learn more
Why us
Why us
Our difference
Reviews
Clients
Compliance
Expertise
Expertise
Creative Marketing Strategy
Brand Design + Development
Web Design + Development
Creative Subscription
Hosting
Domains
Work
Website Design – MamiLac
Branding & Website Design – Akteh
Branding & Website Design – PharmProvide
View All
About
Insights
Let's talk
Ru
Healthcare & Wellness Marketing Isights
Deep
marketing expertise, insights, tutorials,
and resources.
Productivity
Marketing
Company News
Web Design
Reviews
Advertising
eCommerce
Healthcare
Branding
Big News: We’re Going All-In on Creative Work
Jan 9 2025
Gazizoff: Our New Brand Identity
Jul 10 2024
Effective Marketing to Doctors [Comprehensive Guide]
Sep 14 2023
Celebrating a Decade of Success & Embracing a Healthier Future
Aug 8 2023
Why Affiliate Marketing Is a Game-Changer for Your Brand’s Growth
May 11 2023
The Power of Full Funnel Marketing: How to Build a Successful Customer Journey
May 11 2023
Finding a perfect eCommerce marketing agency [Complete guide]
May 10 2023
How to find the perfect email and SMS agency [Complete guide]
May 10 2023
Finding the perfect social media marketing agency [Complete guide]
May 10 2023
Top 8 B2B Challenges + How overcome them with marketing
May 9 2023
Pinterest Ads 101: How to advertise & drive results on Pinterest [Ultimate guide]
May 8 2023
Twitter Ads 101: How to advertise on Twitter [Ultimate Guide]
May 8 2023
LinkedIn Ads 101: How to run ads that drive real results [Complete Guide]
May 8 2023
Facebook Ads 101: How to Run Successful ads and maximize ROAS [Ultimate Guide]
May 8 2023
Google Ads 101: Create High-Performing PPC Campaigns [Beginner’s Guide]
May 8 2023
How to build a high-converting business website [Step-by-step guide]
May 5 2023
Scarcity and Urgency: Proven Tactics for Boosting Conversions and Sales
May 3 2023
What is Stoicism and Its Core Teachings [Beginner’s Guide to Stoicism]
May 3 2023
Top Digital Agencies in Toronto: Find Your Perfect Digital Partner
Apr 26 2023
Top 30 Web Development Agencies in Toronto 2023
Apr 25 2023
Top 30 Web Design Agencies in Toronto 2023
Apr 25 2023
Top 30 Social Media Marketing Agencies in Toronto 2023
Apr 25 2023
Top 30 SEO Agencies in Toronto 2023
Apr 25 2023
Top 30 PPC Marketing Agencies in Toronto 2023
Apr 25 2023
Top 20 Influencer Marketing Agencies in Toronto 2023
Apr 25 2023
Top 25 Email Marketing Agencies in Toronto 2023
Apr 25 2023
Top 30 eCommerce Agencies in Toronto 2023
Apr 25 2023
Top 25 Content Marketing Agencies in Toronto 2023
Apr 25 2023
Top 30 Digital Strategy Agencies in Toronto 2023
Apr 25 2023
Top 20 Digital Advertising Agencies in Toronto 2023
Apr 25 2023
Top 30 Toronto Branding Agencies in 2023
Apr 25 2023
Top 10 B2B Marketing Agencies in Toronto 2023
Apr 25 2023
Top 45 Digital Marketing Agencies in Toronto 2023
Apr 24 2023
In-House vs. Outsourced Marketing: Which one is right for you? [Complete Guide]
Apr 24 2023
Full-Service vs. Specialist Marketing Agency: Which one is right for you?
Apr 24 2023
How to choose a Marketing Agency in 2023 [The Ultimate Guide]
Apr 24 2023
Master the Art of Copywriting: The General Hacks for Crafting Compelling and Effective Content
Apr 18 2023
How to Drive Traffic and Sales Using Digital Advertising [Ultimate Guide to Digital Ads]
Mar 31 2023
How to Drive Real Result with Email Marketing: [Ultimate Guide to Email Marketing]
Mar 30 2023
How to Create a Strong Brand Identity [Ultimate Guide to Branding]
Mar 25 2023
6 Proven Strategies for Creating a Powerful Referral Network in Your Medical Practice
Mar 24 2023
Best Theme, Hosting & Plugins for your WordPress & Woocommerce Site [Complete Tech-stack]
Mar 20 2023
Building A Compliant Healthcare Website [The Ultimate Guide to HIPAA & PHIPA Compliance]
Mar 16 2023
Navigating Privacy Regulations in Marketing & Business [Beginners Privacy Guide]
Mar 15 2023
25 Privacy Regulations Businesses & Marketers Should Know
Mar 14 2023
Healthcare Marketing: How to Connect & Retain Patients in the Digital Age [Complete Guide]
Mar 13 2023
How to a Create Stunning Performance Shopify Store [Our Process]
Mar 7 2023
The Ultimate Marketing Questionnaire
Feb 8 2023
Unlock rapid growth with growth marketing [Beginner’s Guide]
Feb 6 2023
How to a Create Stunning Performance WordPress Site [Our Web Design Process]
Feb 4 2023
How to Make Your Website Accessible [Complete Guide to Web Accessibility]
Feb 4 2023
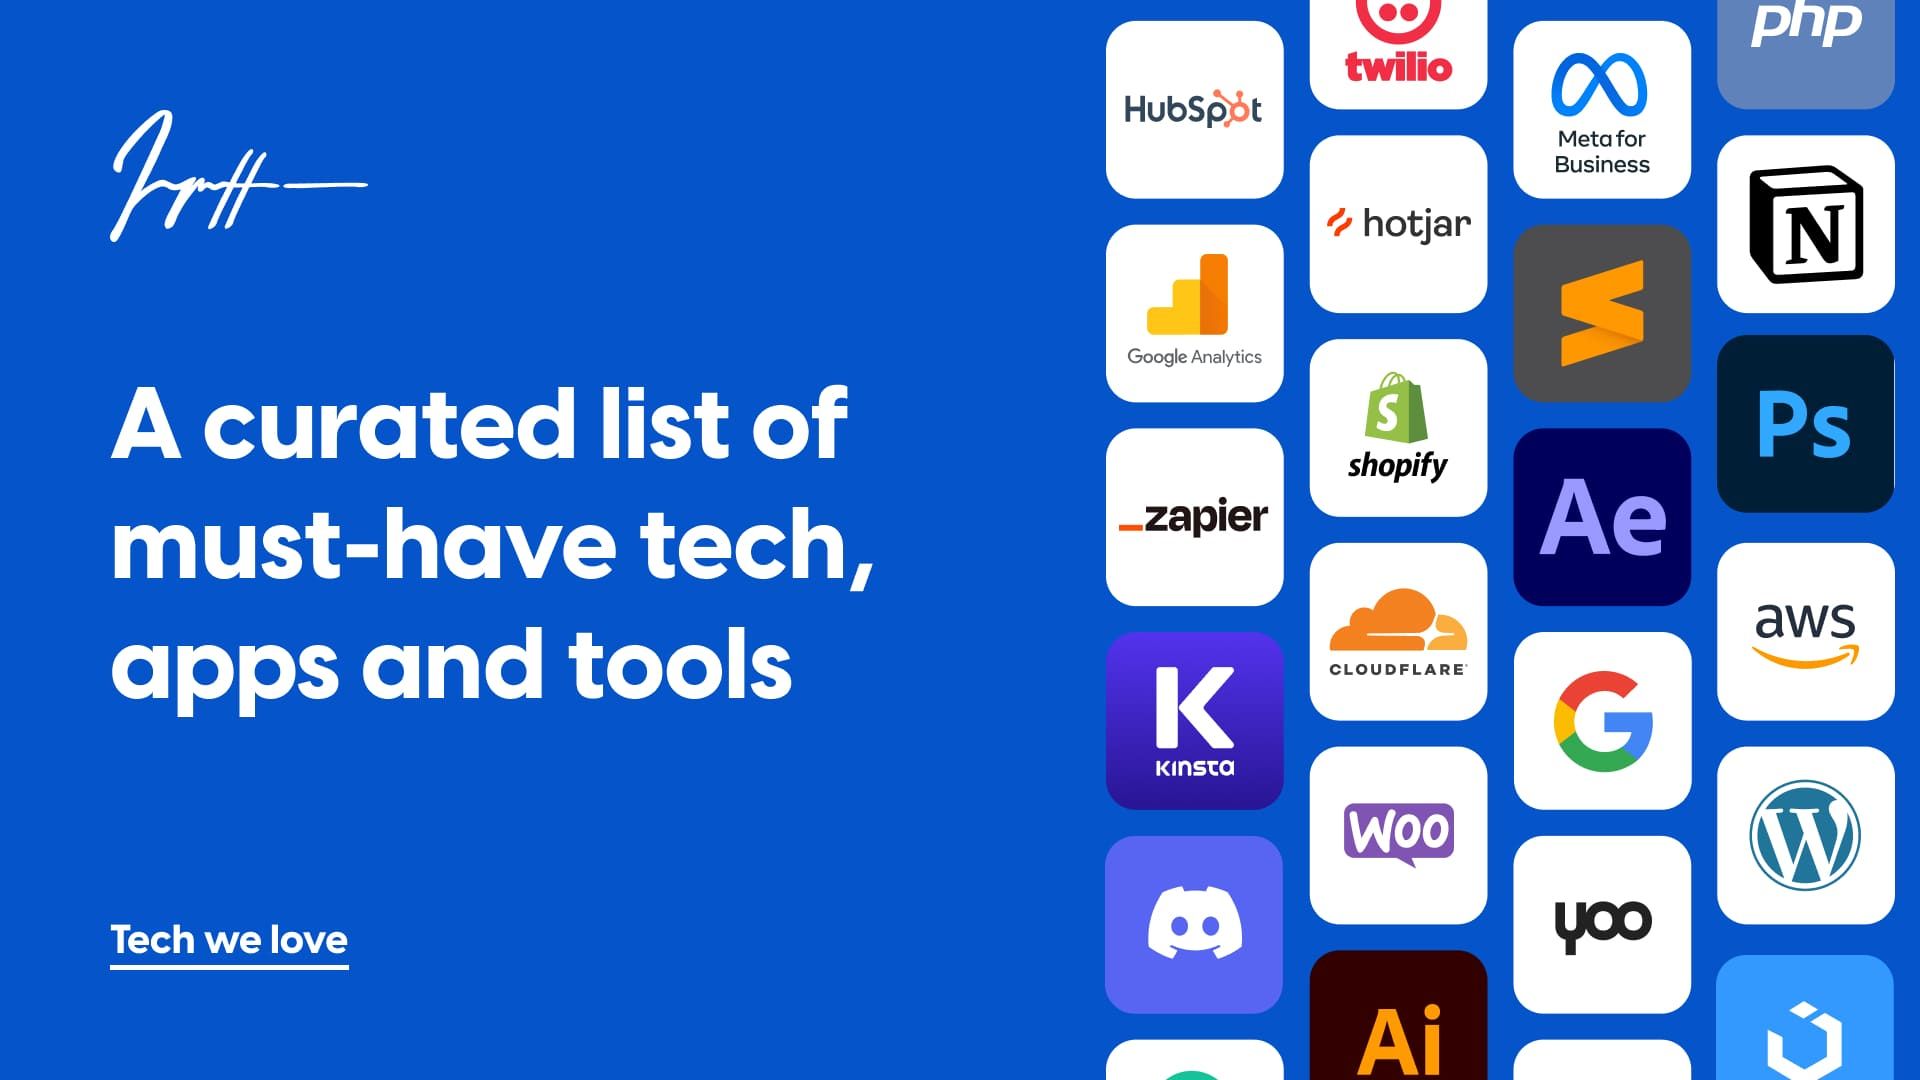
Tech we love
Jan 17 2023
Beginners Guide to Content Marketing [Fundamentals]
Nov 3 2022
Always Tired? Here Is Why
May 20 2022
Adel joins Gazizoff Digital
May 16 2022
Askar joins Gazizoff Digital
Nov 4 2021
Who is Bulat Gazizoff – Full Biography and story
Apr 16 2021
What Makes A Good Website?
Mar 16 2021
The Best WordPress Hosting? 3 Year Kinsta Review
Mar 9 2021
Why You Procrastinate
Feb 4 2021
Get New Leads and Customers FAST and FREE
Jan 28 2021
13 things I wish I Knew Before Starting a Business
Jan 23 2021
Double Your E-commerce Sales Without Doubling Ads
Jan 13 2021
Mission Growth – what is it & why we started it
May 20 2020
Covid-19 and Mission Growth announcement
May 15 2020
Inkar joins Gazizoff Digital
Feb 2 2019
Goodbye Xselle. Hello Gazizoff Digital
May 25 2018